
AP Statistics Variance, Standard Deviation & Z-Score Guide (Population vs. Sample Formulas)
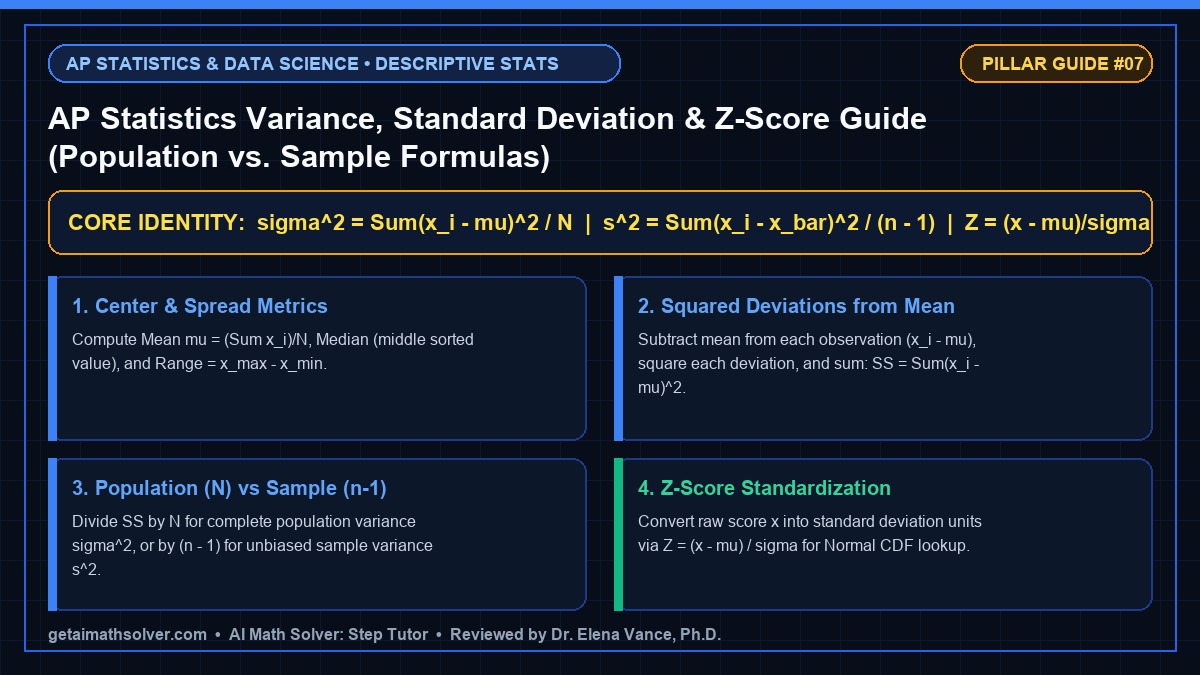
Variance and standard deviation measure how far data points spread out from their arithmetic mean. For a complete population of size N, population variance is σ² = Σ(xᵢ - μ)² / N; for a sample of size n drawn from a larger population, sample variance uses Bessel's correction in the denominator: s² = Σ(xᵢ - x̄)² / (n - 1).
1. Why Sample Variance Divides by (n - 1) Instead of N
One of the most common mistakes in AP Statistics and introductory college data science is mixing up population variance (σ²) and sample variance (s²). Both start with the exact same numerator—the Sum of Squares SS = Σ(xᵢ - mean)².
When your dataset represents the entire population of interest, divide SS by N. When your dataset is only a sample of size n used to estimate an unknown population mean μ, the sample points cluster slightly closer to their own sample mean x̄ than to the true μ. Dividing by degrees of freedom (n - 1)—known as Bessel's correction—removes this downward bias.
2. Outlier Sensitivity, IQR, and Z-Score Standardization
Because the mean and standard deviation square every deviation (xᵢ - μ)², they are non-resistant (highly sensitive) to extreme outliers. For skewed distributions, AP Statistics pairs the median with the Interquartile Range (IQR = Q₃ - Q₁), flagging outliers beyond Q₁ - 1.5·IQR or Q₃ + 1.5·IQR.
For bell-shaped Normal distributions N(μ, σ), the Z-score Z = (x - μ)/σ measures how many standard deviations an observation lies above or below the mean. By the Empirical (68–95–99.7) Rule, 68% of observations fall within |Z| ≤ 1, 95% within |Z| ≤ 2, and 99.7% within |Z| ≤ 3.
3. Quick-Reference Formula & Strategy Comparison Table
| Statistic | Population Symbol & Formula | Sample Symbol & Formula | Resistant to Outliers? |
|---|---|---|---|
| Arithmetic Mean | μ = (Σ xᵢ) / N | x̄ = (Σ xᵢ) / n | No (Pulled toward tail) |
| Variance | σ² = Σ(xᵢ - μ)² / N | s² = Σ(xᵢ - x̄)² / (n - 1) | No (Squares deviations) |
| Standard Deviation | σ = √[Σ(xᵢ - μ)² / N] | s = √[Σ(xᵢ - x̄)² / (n - 1)] | No |
| Median & IQR | Median M, IQR = Q₃ - Q₁ | Median M, IQR = Q₃ - Q₁ | Yes (Robust to extreme values) |
Test This Concept in the Live AI Math Solver Studio
Snap a photo of any handwritten or printed worksheet, or load our pre-built equation directly into the symbolic engine and 2D Grapher.
🚀 Solve & Plot "Dataset {10, 14, 18, 22, 36}" Now4. Frequently Asked Questions (FAQ)
What happens to the mean and standard deviation if I add a constant c to every data point?
Adding or subtracting a constant c shifts every observation equally: the Mean increases by c (μ_new = μ + c), but the Range, IQR, Variance, and Standard Deviation remain completely unchanged.
What happens if I multiply every data point by a constant k?
Multiplying every observation by k scales the Mean, Median, Range, IQR, and Standard Deviation by |k|, and scales the Variance by k².
How do I interpret a negative Z-score?
A negative Z-score (for example, Z = -1.5) means the raw observation x lies 1.5 standard deviations below the distribution mean μ.
Can AI Math Solver compute both population and sample statistics from a list of numbers?
Yes. Paste or photograph any comma-separated dataset and AI Math Solver computes mean, median, range, sum of squares, σ², and s² step-by-step.